
Information Design Services
Visual solutions for complex information and innovation projects.
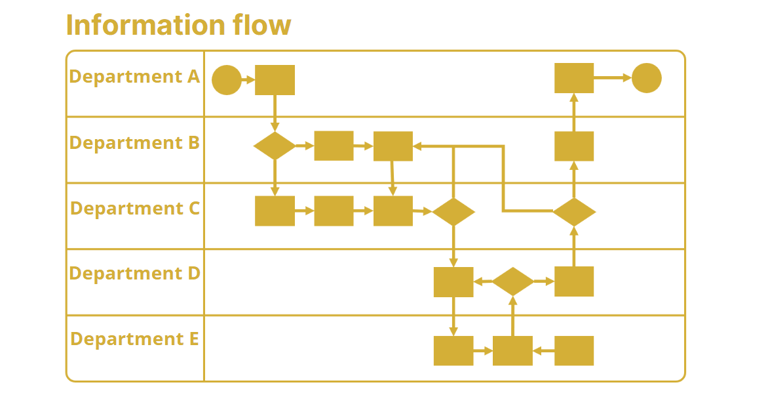
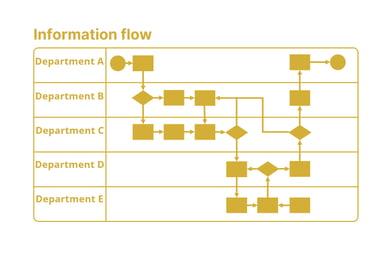
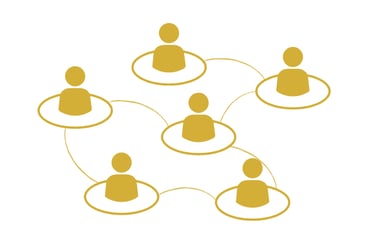
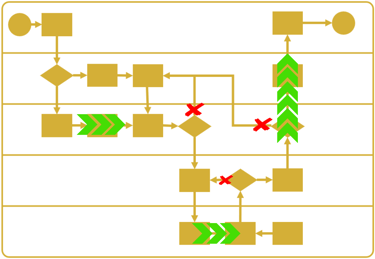
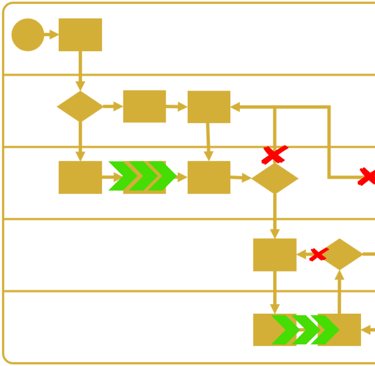
Visualisation of information flows in your company
Visualisation of the processes and flows between your company's departments to optimise information exchange within an innovation project and reduce complexity.
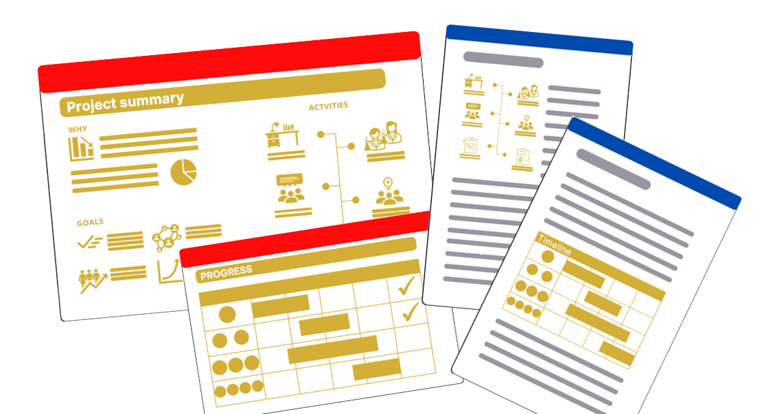
Visuals for your innovation projects
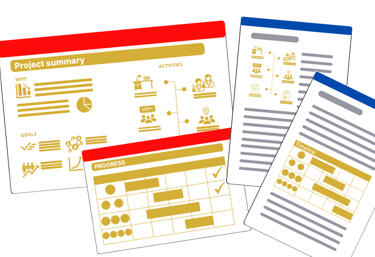
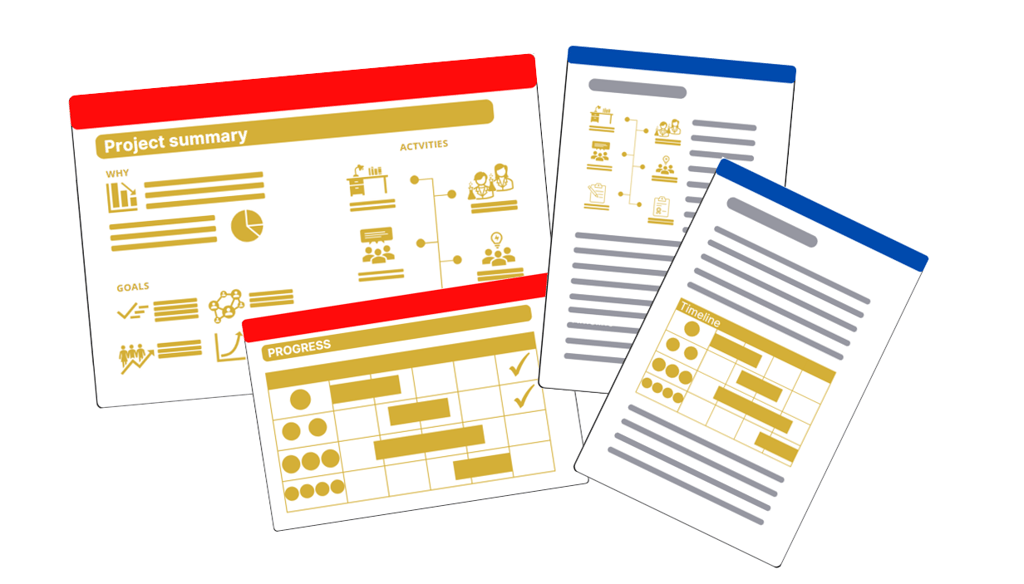
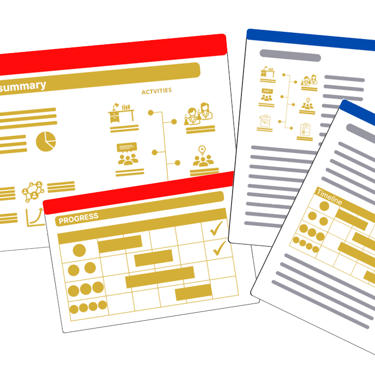
Visual summaries and overviews to concisely and comprehensively convey the essence of your innovation project in a presentation, one-pager or document.
Visuals for your innovation projects
Do you want to increase the success rate of your innovation projects?
When presenting your innovation project – or idea – to your management team, grant providers, (potential) partners and other stakeholders, visuals can help to convey your message clearly. A visual is a type of image that represents the written text in a picture and helps your audience to understand the information better. The visual can also serve as a kind of guideline through the text.
Depending on what you, the management team, the grant provider or others consider important, there are various visuals that can convey the desired information. Visuals are useful to supplement the written information about your innovation project, but also in a PowerPoint presentation. The better your audience understands your idea, the higher the chance of success for your innovation project.
Visualisation of information flows in your company


Needs analysis - Why?
Using targeted questions, we work together to identify what information is needed for the innovation project, what specifically is required, how often the information is needed, etc.
I use business analysis and lean management tools for this purpose.

Stakeholder analysis - Who?
Which department/person is or should be involved in providing information for the innovation project? Is that the right department/person?
What should the department/person do to provide the right information? For example, is there any information readily available that can also be used?
Here too, I use business analysis and lean management tools.
Efficiency gains through better and more accurate information exchange for your innovation projects
Optimalisation & Decision making - Eureka!
We will use the mapped information flow to identify which steps can be optimised and where complexity can be reduced.
The overview will enable well-informed strategic decisions to be made about the next steps.
In some cases, a better mutual understanding of and appreciation for the workings of the other department leads to better coordination and thus more efficient information exchange. In other cases, the solution may be extensive digitisation. The mapped information can also provide IT companies with the necessary background information, enabling them to get started more quickly on optimising or developing the necessary digital tools.
Information flows are already well mapped out for a company's production processes – from customer demand to the delivery and invoicing of products or services.
But what about the information flows for innovation projects in your company? For example, between the R&D department and the accounting, marketing or production department? Are these flows optimal and is the correct information being exchanged between these departments? Or are innovation projects being delayed because they have to wait (too) long for information from other departments?
Would you like to optimise the information flows for innovation projects? Then I would be happy to support you with a three-step plan: Why? > Who? > Eureka!